Using the Pandas library to process battery cycling data.
Today we going to see how to use the python library Pandas on some battery cycling data. Pandas is useful to process Excel files efficiently. Here we will calculate delta V values of a cell versus cycle number from the voltage versus time data. delta V is closely related to the resistance of the cell.
Let’s start by importing the Pandas library:
import pandas as pdNow we are ready to import the data. Here we will import the third sheet from a .xls of a cell with a Cell ID of 87. The output df is a Pandas dataframe.
df = pd.read_excel('CellID87.xls', sheet_name=3)Now is type to start preprocessing. The data in question is cycling data from a Neware cycler. Let’s first remove the part of the data that correspond to when the cell is in status ‘rest’, which mean the cell is not charging or discharging, but just resting, as this data is not needed for the calculation of delta V. Below we are essentially saying: take the row of the dataframe were values from column ‘Status’ are not equal to ‘Rest’.
df = df[df['Status'] != 'Rest']On the block of code, we first take the row of the dataframe were values from column ‘Status’ are equal to ‘CC_DChg’ for the discharge curves (df_disch) and equal to ‘CCCV_Chg’ for the charge curves (df_charg). Then, for the discharge curves, and similarly for the charge curves, we group all values that have all the same step values and take the average. However, we are here only interested in the average of the voltage for each steps as well as the cycle numbers.
df_disch = df[df['Status']=='CC_DChg'].groupby('Step').mean(numeric_only=True)
df_charg = df[df['Status']=='CCCV_Chg'].groupby('Step').mean(numeric_only=True)
We then merge both dataframe df_disch and df_charg into a single dataframe df0. We do this merging such that the cycle number value are the same for both for a single row in df0.
df0 = pd.merge(df_disch, df_charg, on = 'Cycle', how='outer')We then substract the value of average voltage for charge steps from the average voltage for discharge steps.
df0['delta_V'] = df0['Voltage(V)_y'] - df0['Voltage(V)_x']We then reorganise the data so that it can be plotted as delta V versus cycle number.
df01 = df0.set_index('Cycle')
df2 = df01['delta_V'].to_frame().reset_index()
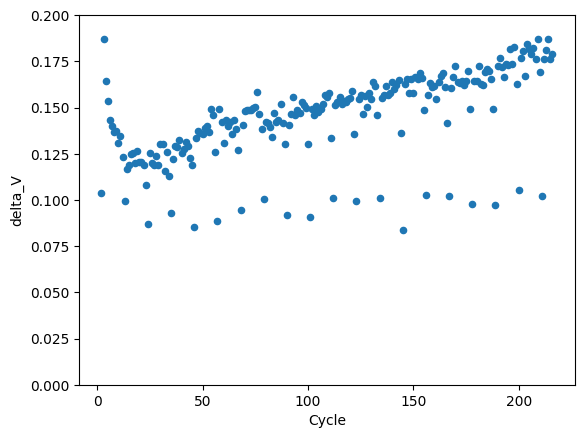
df2.plot(x = 'Cycle', y = 'delta_V',kind='scatter',ylim=(0,0.2))The result is the following graph: